The Problem
Paper charts for growth are increasingly incompatible with modern digital workflows. As a GP, with an electronic health record which at the time did not have growth charts in it, and who is also not usually provided with pre-printed growth chart cards, my workflow for using growth charts was this (in 10 minutes, while actually dealing with the patient’s other healthcare problems):
- (1st visit) Find the correct chart from the confusing array of charts on the RCPCH website
- Download PDF and print out chart
- Measure the child
- Mark on chart the child’s height and weight and manually calculate centiles
- Record height, weight and centiles electronically in the clinical record.
- Send the chart to the secretaries be scanned into the electronic record
- (2nd visit) Find the scanned chart (usually poor resolution due to scanning)
- Print it out again
- Measure the child again
- Mark on the chart and calculate centiles to see the trend.
- Record height, weight and centiles electronically in the clinical record.
- Send the chart to the secretaries be scanned into the electronic record
Unsurprisingly, some people would not bother. It is made exceedingly difficult to do the job properly. But without proper clinical tools to diagnose growth that is outside of normal patterns, clinicians cannot make these diagnoses properly. A particular example is childhood obesity, which is said to be an ‘impending epidemic’ and a ‘public health emergency’. Body Mass Index centile is the gold standard way to properly diagnose childhood obesity, but there is no universally available tool for calculating it.
Anyone who is diagnosing childhood obesity without being able to quantify it, is not doing the job right. Parents may sometimes consider the diagnosis of obesity, made in their child, as a judgement of them as a parent, and I for one feel safer having some clinical evidence to fall back on when I make that diagnosis, so it’s clear the diagnosis is not just my opinion! Additionally, how do you track the progress of lifestyle changes if you haven’t been able to quantify the degree of obesity.
Existing clinical systems can calculate this… right?
Wrong. Despite the mathematics for calculating a centile being straightforward, none of the existing GP systems (EMIS Web, SystmOne, INPS Vision) can actually calculate a centile. All of them can show an image of a growth chart to the user, who then has to manually read off the centile from the chart. A clinician, sitting in front of a computer that could do this calculation, has to read off the centile from the chart. Madness.
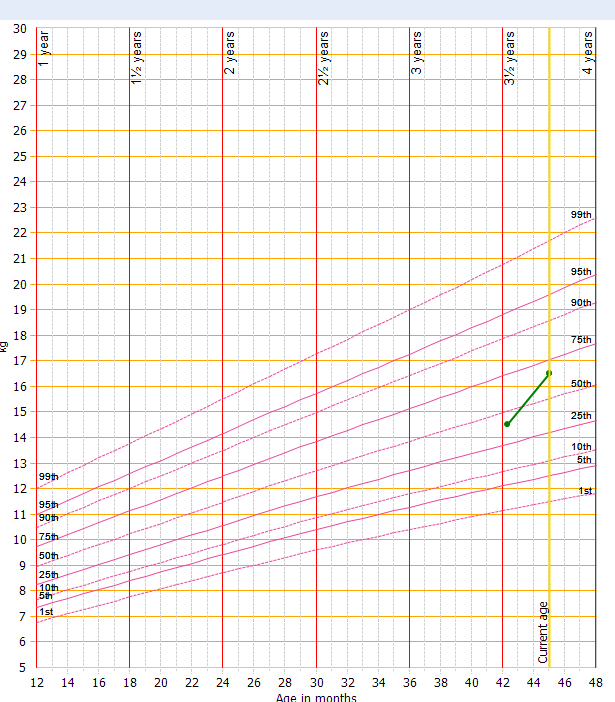
This is a screenshot from one of the mainstream GP systems, showing weight simply being displayed on top of a graphic of the growth charts, with no attempt to calculate record the centile value in structured data, or even to record that a centile was done, except in the clinician’s own free text should they choose to do so.
The vast majority of hospital systems do not have centile calculation or visualisation functionality either. I’m only aware of one implementation, at King’s College Hospital, where they have this, having developed a custom centile suite ‘in-house’. After a short private correspondence, the originators were persuaded to open source their efforts, however their system is not easily replicable to other sites.
eRedBook
The developers of the long-awaited 0-5 years electronic version of the Red Book, which is a proprietary platform, have told me informally that it can calculate a centile. But I have not seen a public demonstration of this.
The Dataset Problem
The UK90 dataset which is used in the UK to calculate centiles from the age of 4 to 18 is proprietary. It’s copyright of the Medical Research Council/Prof Tim Cooke, and although they have indicated that they will grant a license to anyone who asks, the license application process took 9 months in my case.
This data, for calculating child health parameters is a national asset and should be open data. When discussing this issue, I’ve encountered a degree of confusion among some fairly senior clinicians about who owns this data, with some asserting that the Royal College of Paediatrics and Child Health own the dataset.
Attached is the license to use this data, which I applied for from the MRC, on behalf of openhealthhub CIC, which at the time was called openGPSoC CIC. It clearly states that the MRC own the dataset.
2014.04.16 MRC-openGPSoC Licence Agreement for use of UK90 LMS Tables.pdf (1.4 MB)
Marcus
NEXT: Centile Part 3: Existing stuff that attempts to solve this problem